(Linear
Demand Curve)
Geometric method measures price elasticity of demand
at different points on the demand curve.
It is also called ‘point method’ of measuring elasticity of demand.
We would be using linear demand curve, which is a straight line demand curve.
As shown in the below graph :
It is also called ‘point method’ of measuring elasticity of demand.
We would be using linear demand curve, which is a straight line demand curve.
As shown in the below graph :
 |
| linear demand curve |
MN
is
a straight line demand curve sloping downwards.
P is a mid point on the demand curve.
It divides the demand curve into two equal segments,
lower segment (PN) and upper segment (PM)
PN = Line segment below the point on the demand curve
It divides the demand curve into two equal segments,
lower segment (PN) and upper segment (PM)
PN = Line segment below the point on the demand curve
Price Elasticity of
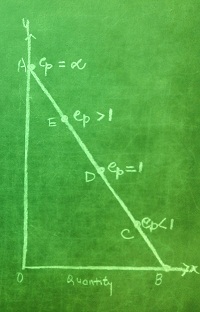
demand at different points on Straight line Demand Curve
We
can use the above mentioned method
of point elasticity in measuring elasticity at different points on a straight line demand curve
starting from Y axis and terminating at X axis.
 |
| demand curve |
Following situation is evident from
above graph using the above formula:
1)
At point A (touches y axis)
ep
(at A) = AB / 0 =
infinity (∞)
2)
At any point above the midpoint but below A, say at point E
ep
(at E) = BE / EA > 1
Because the lower segment is greater than the upper
segment, i.e. BE > EA
3) At the midpoint D
ep
(at D) = BD / DA = 1
Because the lower segment is equal to upper segment,
i.e. BD = DA
4) At any point below the midpoint but above B, say
at C.
ep
(at C) = BC / CA < 1
Because the lower segment is smaller than the upper
segment, i.e. BC < CA
5) At point B (touches X axis)
ep
(at B) = 0/ AB = 0
Hence we can generalize that a straight line demand
curve is more elastic towards its left hand end and less elastic towards the
right hand end.

No comments:
Post a Comment